Week of April 11, 2025 Weekly Recap & The Week Ahead
Tuesday, April 15th, 2025“keep your head while others are losing theirs” Rudyard Kipling
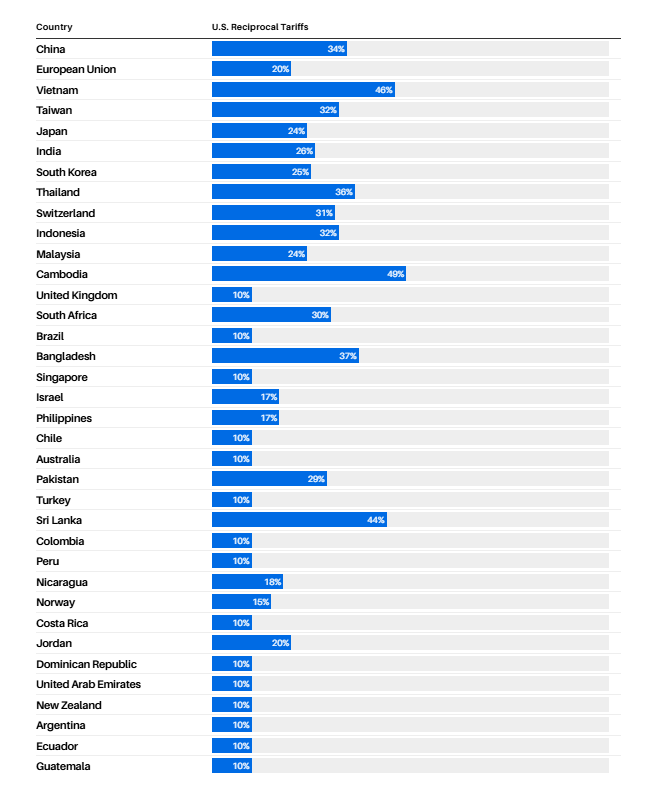
1. Trump: 10% Tariffs Across the Board. ‘Worst’ Trade Partners Will Pay More — Trump presented a large chart listing the specific tariff levels for certain countries, which can be seen below. These include a 34% tariff on goods from China, 46% on those from Vietnam, and 32% on those from Taiwan. Cambodia has the highest tariff rate of any country at 49%. Goods from the European Union will be levied at a 20% rate. “You know, you think of European Union, very friendly. They rip us off. It’s so sad to see. It’s so pathetic,” he said.
2. US Services Index Falters as Employment Shrinks Most Since 2023 — The Institute for Supply Management’s gauge of services dropped to 50.8 from 53.5 a month earlier, according to data released Thursday. The figure was weaker than all but one estimate in a Bloomberg survey of economists. Readings above 50 signal growth. A month earlier, the employment index advanced to the highest level since the end of 2021. A Wednesday report showed private-sector hiring accelerated in March by more than projected in a fairly broad advance.
A sustained trend of weaker employment readings may raise concerns of a broader slowdown in a labor market that has been the economy’s bedrock. Meanwhile, the ISM prices-paid index eased slightly to a still-elevated 60.9 in March.
3. Trump Pauses ‘Reciprocal’ Tariffs, but Hits China Harder — Trump said Wednesday that his 10%, baseline tariff on virtually all imports would stay in effect. But he implemented a 90-day pause for the higher, so-called reciprocal rates he had announced a week earlier on nations the administration views as “bad actors” on trade—except for China. In an early afternoon social-media post, Trump wrote that he had raised the tariff imposed on China to 125%, “effective immediately.” An administration official said that Canada and Mexico would remain exempt, for now, from the 10% baseline global tariff. While America’s neighbors remain subject to plans to impose 25% tariffs on most imports to the U.S. for what Trump says is their role in fueling the fentanyl crisis, an exemption is still in place for these levies on autos and many other goods compliant with the U.S.-Mexico-Canada trade agreement.
4. Consumer Sentiment Sinks, Approaching Three-year Low with Inflation Worries Highest Since 1981 — The University of Michigan’s gauge of consumer sentiment fell to 50.8% in a preliminary April reading from 57.0% in the prior month. It is the lowest level since June 2022. Sentiment has dropped for four straight months and is down 30% from December. Federal Reserve economists believe that if consumers expect high inflation, it will be easier for firms to raise prices, leading to higher price pressure.
The week ahead — Economic data from Econoday.com:
 Posted in
 Major Indexes Break Above 200-SMA on Low Volume
Tuesday, August 3rd, 2010The major indexes (S&P500, Dow Jones & Nasdaq) break above the 200-sma on lower volume.
So far, half way through earnings season, roughly 78% of the S&P 500’s companies have beaten their earnings estimates. Two out of three companies have beaten sales estimates.
Raymond James strategiest, Jeff Saut noted “The July Jump has had another endearing feature in that the three consecutive 100-point “up days” in the D-J Industrial Average (DJIA/10465.94) catapulted the Dow above its June closing high of 10450.64 last Monday. Simultaneously, the D-J Transportation Average (DJTA/4422.94) closed above its June high of 4433.60, thus registering a Dow Theory “buy signal,” at least as I interpret Dow Theory. Ladies and gentlemen, a same day confirmation from both averages is a rare event and suggests a fairly powerful “up move” is underway. That said, Dow Theory signals often come after a significant rally (or decline) has already taken place and hence has expended a lot of energy.
Also worth noting is that a number of other Dow Theorists opine an upside signal has not yet been registered. They need a close above the Dow’s April 23rd price of 11204.28, with a confirmation by the Transports above its May 3rd closing high of 4806.01, for a Dow Theory “buy signal” to be rendered. Alas, “listening” to the market is an art, not a science, and Dow Theory is interpreted differently by many practitioners. Nevertheless, by my pencil a “buy signal” has been registered and I am a buyer on weakness with fairly close stop-loss points to manage the risk.
Also noted by Lowry ‘s research “In summary, as the major price indexes have moved sideways since the May 25th low, market conditions have showed clear signs of strengthening, not weakening. While overbought readings on short-term indicators suggest the potential for a near-term pullback, any decline should act only as a temporary setback in the rally from the July 2nd low and is unlikely to represent the next leg of a more prolonged move lower.”
Below are the charts of the S&P500, Dow Jones & Nasdaq.


Wed June 29 – Market Update
Tuesday, June 29th, 2010Every mistake has a halfway moment, a split second when it can be recalled and perhaps remedied — Pearl Buck
We have changed our market outlook from bullish to cautious for a number of reasons:
The major indexes were rejected at the 50-SMA resistance. As of today’s close, all three indexes (S&P500, Dow Jones & NASDAQ) all closed at May & June ‘s lows.
In particular, the S&P500 drops to fourth test of 1,040 support; If the S&P500 breaks support at 1,040, it may follow to the 1,007 area, matching a 38% retracement of the rally from the 2009 low; Also, the Dow Jones must hold support at 9,818; A break below this level will trigger the “sell signal” according to the Dow Theory where the primary trend is now down!
Below is a chart of the S&P500 courtesy from Reuters.

Furthermore, the S&P500 & Dow Jones are showing an ominous head-and-shoulder pattern & potential “death-cross” where the 50-sma crosses below the 200-sma.
An interesting article from Jeff Saut, Investment Strategist from Raymond James “suggested the equity markets were likely going to be in a trading range pattern similar to the 1966 – 1982 affair. Clearly, that is what has occurred over the last 10 years. Most recently, the 54% slide from The Dow’s October 2007 peak into its March 2009 low has been followed by a 70%+ rally that ended in April of this year. Subsequently, the senior index experienced it first double-digit decline since the March 2009 bottom, ushering in cries of “the bear market rally is over!” To me, however, all that’s transpired is another decline within the context of the broad trading range the Dow has been in since the turn of the century“; Below is a chart from Jeff Saut showing 13 rallies/declines of more than 20% from 1966 – 1982.

Below are the charts for the DJIA, SPX & NASDAQ.
SPX — prior support at 1,040

DJIA — prior support at 9,760

Flipping Bullish – 2nd Q Earning Season
Wednesday, June 16th, 2010We are flipping bullish and starting to nibble on the long side. Multiple bullish indicators are in-play.
1. Bearish Magazine cover — Bloomberg magazine cover

2. Put/Call Ration approaching extreme — investors display extreme fear by purchasing protection at/near short-term extreme. Here is the link to Barron’s article for more details
.
EU – Greece Problem Update
Thursday, May 6th, 2010As expected, the EU/IMF approved Greece’s bailout package to the tune of over $140 billion. However, the problem now has spread to Portugal & Spain as costs to insure Portugal & Spain spiked upward.
The New York Times posted a nice chart detailing the contagion with the PIIGS countries.

Apr 15 2010 – 50SMA Stocks
Thursday, April 15th, 2010
AN — Autonation (Car Sales)
MWW — Monster Worldwide (Temp Agency)