Week of July 28, 2024 Weekly Recap & The Week Ahead
Tuesday, July 30th, 2024In order of importance to me are: 1) the long term trend, 2) the current chart pattern, and 3)picking a good spot to buy or sell.
Ed Seykota
1. U.S. Home Prices Hit Record in June for Second Consecutive Month — the spring home-buying season, usually the busiest time of year for the housing market, was a dud this year. Home sales declined in June for the fourth straight time on a monthly basis. The combination of high prices and elevated mortgage rates has made homeownership less attractive to renters and deterred current homeowners from moving. But low inventory of homes for sale in much of the country is pushing prices higher. The national median existing-home price in June rose to $426,900, a record in data going back to 1999 and a 4.1% increase from a year earlier, the National Association of Realtors said Tuesday. Prices aren’t adjusted for inflation. Sales of previously owned homes in June fell 5.4% from the prior month to a seasonally adjusted annual rate of 3.89 million, NAR said. On an annual basis, existing-home sales, which make up most of the housing market, also fell 5.4%.
2. US New-Home Sales Unexpectedly Decline to a Seven-Month Low — Contract signings on new single-family homes decreased 0.6% to a 617,000 annual pace, the slowest since November, according to government data released Wednesday. The figure compared with a 640,000 median estimate in a Bloomberg survey of economists. The latest figures follow a topsy-turvy first half of the year, with sales gaining ground throughout the spring before slumping in May by the most in nearly a year. Thirty-year mortgage rates have dipped below 7% in recent weeks, but remain double what they were at the end of 2021, encouraging many builders to offer sales incentives such as buying down customers’ mortgages. Meantime, builders have continued to add supply, with inventory edging up to 476,000 homes in June, still the most since 2008. At the current rate of sales, that inventory would last 9.3 months, the longest since October 2022.
3. US Economy Grew Faster Than Expected Last Quarter on Firm Demand — Real gross domestic product, a measure of all the goods and services produced during the April-through-June period, increased at a 2.8% annualized pace adjusted for seasonality and inflation. Economists surveyed by Dow Jones had been looking for growth of 2.1% following a 1.4% rise in the first quarter. Consumer spending helped propel the growth number higher, as did contributions from private inventory investment and nonresidential fixed investment, according to the first of three estimates the department will provide. Personal consumption expenditures, the main proxy in the Bureau of Economic Analysis report for consumer activity, increased 2.3% for the quarter, up from the 1.5% acceleration in Q1. Both services and goods spending saw solid increases for the quarter.
4. U.S. Inflation Data Keeps Door Open For September Interest Rate Cut — the Department of Commerce said Friday its personal income expenditures inflation gauge rose 2.5% in June compared to a year earlier, slowing for its 2.6% pace in May. Excluding volatile food and energy prices, PCE inflation rose 2.6%, the same as in May. Following the data release, Treasury yields declined in an indication of investors’ increasing expectations that monetary easing is about to start. The 10-year yield was recently at 4.20%. The Federal Reserve targets 2% inflation and the PCE is its preferred gauge. The U.S. central bank is widely expected to keep rates at current high levels next Wednesday, while opening the door wider for a cut in September.
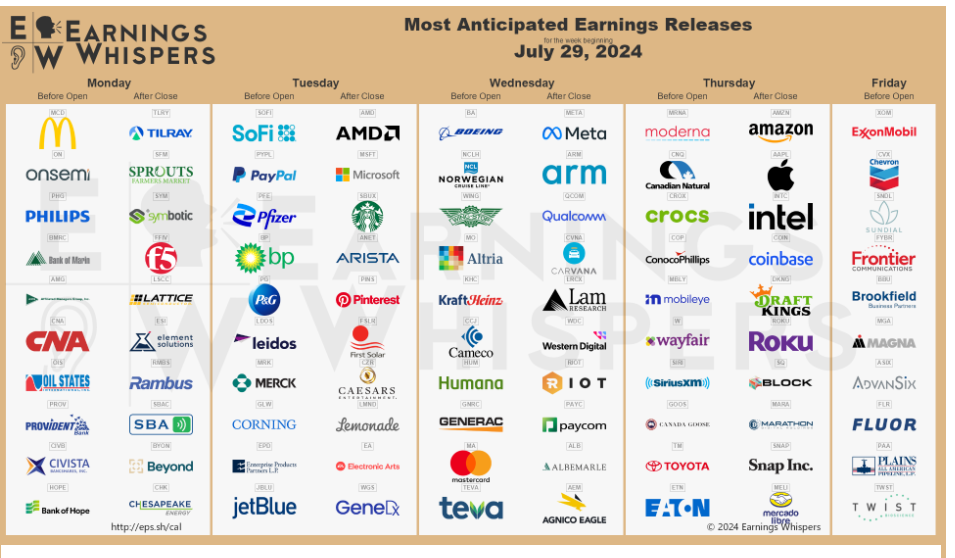
The week ahead — Economic data from Econoday.com: